
The Map is Not the Territory, But the Patterns Are Telling
Over three decades of steering financial operations, I have learned to trust patterns more than predictions, systems more than snapshots, and questions more than answers. This instinct—honed across boardrooms, budgets, and business cycles—has served me well in Silicon Valley’s unforgiving corridors, where the pace of decision-making is fast, but the cost of misalignment is even faster.
From the outside, revenue operations appear deceptively linear: leads flow to sales, deals get structured, contracts are signed, and revenue materializes. But from the inside—especially when viewed through the lens of systems thinking—the reality is far more entangled. Revenue is not the product of isolated events; it is the emergent property of an interconnected web of people, processes, and signals. One of the most misunderstood among these signals is the Net Promoter Score.
The NPS Illusion: Useful Signal or Siren Song?
When Fred Reichheld first introduced the Net Promoter Score, it offered a simple question with purportedly predictive power: “How likely are you to recommend this product or service to a friend or colleague?” As a CFO with deep roots in data science and systems theory, I see the appeal. NPS is compact. It’s comparable. And it claims correlation with growth.
But simplicity can mislead. In practice, NPS is riddled with biases—selection, response, and context—all of which distort its signal. A high NPS from a narrowly selected sample may obscure systemic weaknesses. Conversely, a low NPS spike during a transitional quarter may trigger an overreaction. Noise, when dressed up as insight, can be worse than ignorance.
The real value of NPS lies not in the score but in its integration into a broader feedback system. On its own, it’s a dot. Connected with churn data, cohort behavior, and LTV calculations, it becomes a constellation. And in business, constellations guide better than stars.
Connecting the Dots: Revenue Operations as a Living System
To make NPS actionable, I treat it as part of a diagnostic suite—never as a solitary metric. I’ve seen too many dashboards celebrate a high NPS quarter, while quietly bleeding renewals through the back door. So I ask: who responded, and why? What’s the churn rate of detractors versus passives? Are promoters driving referrals, or are they just polite?
This is where systems thinking reshapes operations. In a well-tuned revenue operation, deal desk doesn’t just price efficiently—it also surfaces friction signals back into sales playbooks. Sales doesn’t just close deals—it flags product misfits to marketing. Marketing doesn’t just drive leads—it diagnoses acquisition cost anomalies by source. When these loops are closed, revenue becomes predictable. When they’re open, it’s anyone’s guess.
In one SaaS transformation I led, we rewired our QTC (quote-to-cash) engine to not only streamline contracting, but also to capture structured feedback at each step. Deal desk logged the number of iterations per contract. Sales recorded the type of pricing objections. Finance tracked cycle time drift. Each touchpoint became a sensor, not just a transaction.
The result wasn’t just faster deals—it was better segmentation, more intelligent bundling, and ultimately, higher gross margin. That’s the power of treating revenue ops not as a pipeline, but as a learning system.
From Metrics to Meaning: Measuring Customer Health Holistically
Let’s go back to the metrics. As CFO, I care deeply about LTV (lifetime value), CAC (customer acquisition cost), and churn. But I’ve learned that these metrics, while vital, are retrospective. They tell me what did happen. What I often seek is an early signal of what will.
This is where survey data—if used judiciously—enters. When the Chief Revenue Officer scores accounts not just by ARR but also by sentiment, usage frequency, and service responsiveness, we begin to build a real-time risk radar. Suddenly, the account with growing ARR but declining engagement becomes visible before it becomes a headline churn.
I advocate for triangulating feedback: combine NPS with support ticket data, product usage telemetry, and even qualitative verbatims. Then run correlation analyses to separate signal from noise. It’s not enough to know that a customer is unhappy—we must know what kind of unhappiness predicts risk. In one instance, we discovered that a certain type of negative comment—pertaining to billing transparency—correlated more strongly with churn than general dissatisfaction. That insight didn’t come from intuition. It came from regression.
The Role of Deal Desk: Guardian of Frictionless Value
Too often, the deal desk is seen as the bureaucratic bottleneck—a function that slows things down in the name of control. In my experience, a well-run deal desk is the opposite. It’s the neural bridge between finance, sales, and product strategy. It doesn’t just apply guardrails—it feeds intelligence back into product-market fit.
We’ve institutionalized this by enabling dynamic rule engines that adjust pricing tiers based on regional win-loss analysis. When sales leaders see that Latin American enterprise wins spike with a particular bundling strategy, that rule is codified into our CPQ system. Conversely, when discounts rise but win rates don’t, we pause and analyze.
That’s not sales ops. That’s strategic learning in motion.
Bringing it All Together: Strategy as Emergence
What I’ve come to believe—across years of scaling businesses and restructuring operations—is that strategy is not a static plan. It’s an emergent outcome of sensing, learning, and adapting. The organizations that thrive don’t just execute well. They listen better. They close feedback loops faster. And they treat each touchpoint—sales call, support ticket, contract redline—not just as a transaction, but as a data-bearing event.
Revenue operations, when viewed through this lens, becomes a force multiplier. It connects disciplines, collapses silos, and tunes the organization to act as a single adaptive organism. In that context, NPS is no longer a vanity score. It’s a directional antenna.
As I continue to reflect on decades of data and decisions, I’m reminded of something simple but enduring: the most elegant solutions are usually those that acknowledge complexity, not deny it. The best operators don’t chase efficiency at the expense of learning. They design systems that listen, adapt, and evolve.
And in the end, that’s the real promoter score that matters.
The Hidden Friction: Complexity That Masquerades as Process
Every enterprise, as it scales, develops rituals. We call them processes, workflows, playbooks. But behind the illusion of structure often lies something more chaotic—an accumulation of tactical choices, defensive design, and legacy thinking. Revenue operations is particularly prone to this. Each team—Sales, Finance, Customer Success, Marketing—optimizes for its own KPIs, and over time, those KPIs calcify into silos. Communication erodes. Velocity drops. Disputes over who “owns the number” begin.
I’ve encountered this many times across the revenue stack. Sales wants autonomy. Finance wants accountability. Legal wants compliance. And somewhere in between sits the deal desk, often underpowered and poorly understood. But I’ve found that when we treat revenue operations as an adaptive system—rather than a linear pipeline—we reclaim both alignment and agility.
This isn’t theoretical. In one engagement, a tangled QTC process delayed deal closure by over three weeks on average. Each department was optimized for its own risk lens—finance scrutinized payment terms, legal focused on indemnities, and sales chased quarter-end velocity. No one owned the full arc. We dismantled that structure, not by adding more steps, but by embedding intelligence into the system. We implemented pre-approved clause libraries, dynamic discounting thresholds, and contract scorecards based on deal complexity. The result? Median cycle time dropped 42% in two quarters. But more importantly, trust among the teams increased.
Trust, I’ve come to believe, is the compound interest of operational design. It accrues when signals are shared, actions are predictable, and feedback is reciprocal. The more we build systems that close loops—between teams, between timeframes, between intention and impact—the more antifragile our operations become.
Designing for Decision Quality, Not Just Efficiency
Most operational frameworks aim for efficiency. They standardize inputs, reduce steps, and automate decisions. But in environments characterized by uncertainty—new markets, product launches, complex enterprise sales—efficiency without context becomes fragility. I advocate instead for designing systems that optimize decision quality.
This begins with instrumentation. Just as pilots rely on cockpit telemetry, revenue leaders need dashboards that aren’t just pretty—they need to be predictive. This means going beyond lagging metrics like bookings and instead embracing leading indicators: opportunity velocity by segment, time-in-stage by sales rep, forecast accuracy over trailing periods, and even email sentiment analysis in customer success.
In one company, we discovered a curious pattern: deals that had more than two rounds of redlining on indemnity clauses were three times more likely to churn within a year. That insight didn’t surface from anecdote—it came from statistical tagging of contract terms and linking that with customer health metrics downstream. We integrated that insight into our deal desk playbook. Deals with multiple legal escalations now trigger proactive onboarding support and periodic QBRs. The outcome? Churn in that cohort dropped 18% YoY.
These insights do not emerge by accident. They require a culture of hypothesis, rigorous data practices, and the humility to interrogate success. As a CFO with a background in applied economics and data science, I often return to the basics: Is this a correlation or a causation? What is the signal-to-noise ratio? Are we overfitting our past into our future?
This is where NPS, again, plays a pivotal role—but only when handled with nuance.
NPS Revisited: Building a Predictive Feedback System
It is tempting to treat Net Promoter Score as a north star, especially in customer-centric organizations. But in practice, it is closer to a weather vane—it shifts with timing, with sampling, with context. What matters is not the absolute score, but the delta—the change over time within comparable cohorts.
We began treating NPS as a vector, not a scalar. Rather than obsessing over whether our score was 57 or 68, we studied trajectory. Did the NPS for our largest segment improve post-onboarding? Did the score among recently migrated users improve or decline? Did regional NPS correlate with local support responsiveness?
We also paired NPS with behavioral telemetry. For example, we discovered that when usage of a specific reporting feature increased, NPS rose predictably within 60 days. That feature, though minor, became a proxy for customer value realization. We doubled down on its UX, added onboarding tutorials, and proactively encouraged its adoption. The impact wasn’t just happier customers—it was reduced churn and higher expansion bookings.
If NPS is the voice of the customer, usage data is the body language. When the two align, the story is trustworthy. When they diverge, it’s a call to investigate.
Sales Operations: Where Discipline Meets Storytelling
Let us not forget the frontline—sales operations. Here, systems and storytelling must coexist. Sales teams need precision on quotas, territories, incentives. But they also need narrative coherence. Why are we focusing on this ICP now? Why does this pricing tier matter? Why should this win-loss trend inform our next SKO theme?
I’ve often found that revenue operations becomes credible when it serves both sides of the brain: it delivers data with integrity, but it also offers frameworks for action. For example, we built a “Deal Confidence Index” that aggregated stage progression, CRM hygiene, past win-rates by rep, and product match score. This wasn’t just a forecasting tool—it was a coaching tool. Reps began to see their pipeline as a learning portfolio, not just a quota treadmill.
Sales leaders appreciated the visibility. Finance appreciated the predictability. And the CEO appreciated the credibility.
That’s the kind of alignment systems thinking enables—not by enforcing conformity, but by designing conditions where better decisions emerge naturally.
Toward a Learning Enterprise: Feedback as Infrastructure
All of this points toward a larger ambition: to build not just efficient revenue engines, but learning enterprises. Companies that thrive over time do not simply out-execute their competitors—they out-learn them. They convert feedback into insight faster, and insight into action more decisively.
This requires treating feedback as infrastructure. Not an annual survey. Not a postmortem ritual. But a living system of sensing, analysis, and iteration. Every deal lost is a datapoint. Every churned customer a case study. Every renewal a reinforcement of value. Every escalated ticket a warning flare.
We can—and should—instrument all of these. But more than the tooling, it requires a mindset. One that sees ambiguity not as a threat, but as an invitation to investigate. One that respects data, but honors judgment. One that values velocity, but never at the expense of coherence.
Final Reflection: From CFO to Systems Steward
Over the years, I’ve come to see the CFO role not merely as custodian of financials, but as steward of the system. Finance sits at the confluence of truth and trust. We see patterns before others do—because the numbers always whisper first. But it is not enough to see. We must translate. We must architect. We must challenge the enterprise to think in terms of loops, not lines.
Revenue operations, when orchestrated well, becomes the metronome of the organization. It synchronizes intent with execution. It turns insights into outcomes. It does not merely count what happened—it changes what happens next.
In a world increasingly shaped by complexity, ambiguity, and noise, our greatest edge is not certainty. It is adaptiveness. And the organizations that master this—those that learn faster, align tighter, and execute smarter—will not just grow. They will endure.
Understanding NPS: The Metric Behind Loyalty
What is NPS?
Net Promoter Score (NPS) is a widely used metric that measures customer loyalty and satisfaction. It is based on a single question:
“How likely are you to recommend our company/product/service to a friend or colleague?”
Customers respond on a scale of 0 to 10, where:
- 0–6 are Detractors (unhappy customers who may damage your brand through negative word-of-mouth).
- 7–8 are Passives (satisfied but unenthusiastic and vulnerable to competitive offerings).
- 9–10 are Promoters (loyal enthusiasts who will keep buying and refer others).
How Is NPS Calculated?
The formula is straightforward:
NPS = % of Promoters – % of Detractors
For example, if you survey 100 clients:
- 60 respond with 9 or 10 (Promoters)
- 20 respond with 7 or 8 (Passives)
- 20 respond with 0–6 (Detractors)
Then:
- Promoters = 60%
- Detractors = 20%
NPS = 60% – 20% = +40
NPS is expressed as an integer between –100 and +100.
How to Interpret NPS Scores
Benchmarking NPS
While NPS benchmarks vary by industry, here’s a general guide:
| NPS Score | Interpretation |
|---|---|
| +70 and above | World-class |
| +50 to +69 | Excellent |
| +30 to +49 | Good, above average |
| 0 to +29 | Acceptable, room to improve |
| Below 0 | Problematic—customer loyalty is at risk |
IT Services Benchmark (based on Satmetrix and Bain & Co. studies):
- Managed IT services: 30–50
- Enterprise SaaS: 20–40
- Cloud infrastructure & platform providers: 30–60
- IT consulting: 20–35
Context matters. A +35 score in IT services may represent strong performance in a complex, B2B environment with longer sales cycles and implementation complexity.
Drawing Inferences from NPS
- Trend is more valuable than a single score. Look for movement over time by segment, geography, product line, or delivery team.
- Segment by customer type. Large enterprise vs. SMB. New vs. long-term. Different user personas yield different loyalty signals.
- Cross-tabulate NPS with churn. Are Detractors more likely to churn or downgrade? Are Promoters expanding faster?
- Track NPS before and after key touchpoints. Onboarding, support cases, renewals, or project delivery completion.
- Tie to behavioral metrics. Usage frequency, feature adoption, and support responsiveness often correlate with NPS trajectory.
How to Design a Strong NPS Survey
A good NPS survey does two things:
- Captures the quantitative score
- Asks why in an open-ended follow-up
Here’s how to structure it:
1. Start with the Core NPS Question
“On a scale of 0 to 10, how likely are you to recommend [Company Name] to a friend or colleague?”
2. Ask for Qualitative Feedback
“What is the primary reason for your score?”
This helps contextualize sentiment and identify recurring themes (e.g., communication, expertise, timeliness).
3. Add Optional Diagnostic Questions
To enrich insights (especially in IT services), add:
- “How would you rate our technical expertise?”
- “How responsive is our team to your needs?”
- “How easy is it to do business with us?”
- “What could we do better to improve your experience?”
These questions should use Likert scales (1 to 5 or 1 to 7) or dropdowns, and should be optional to encourage higher response rates.
Sample NPS Questionnaire for an IT Services Client
Below is a tailored survey designed for B2B IT services clients (e.g., managed services, support, integration):
Subject: Help Us Improve – Quick 2-Minute Survey
Dear Okta,
Thank you for choosing [Your Company Name] as your IT services partner. Your feedback is incredibly valuable to help us serve you better.
Please take 2 minutes to answer this short survey:
1. Core NPS Question
On a scale of 0 to 10, how likely are you to recommend [Your Company Name] to a friend or colleague?
[0 – Not at all likely] ? [10 – Extremely likely]
2. Open-Ended Question
What is the primary reason for your score?
[Open Text Box]
3. Supporting Diagnostic Questions (Optional)
a. How would you rate the following on a scale of 1 (Poor) to 5 (Excellent)?
- Our technical expertise
- Responsiveness to your needs
- Communication and collaboration
- Understanding of your business
- Quality of delivered solutions
- Ease of working with our team
[Each rated on 1–5 scale]
4. Optional Comments
Do you have any other suggestions or feedback for us?
[Open Text Box]
Thank you for your time and insights. We take every response seriously and use it to improve how we serve you.
Sincerely,
BeyondID
VP of Finance and Analytics
Final Thoughts: Making NPS Actionable
NPS is a directional signal, not a KPI to game. Its power lies in how you use it:
- As a predictor of retention
- As a benchmark of progress
- As a trigger for action
Combine NPS with behavioral, operational, and financial data to spot gaps early, intervene with empathy, and create systems that reinforce loyalty through action—not just measurement.
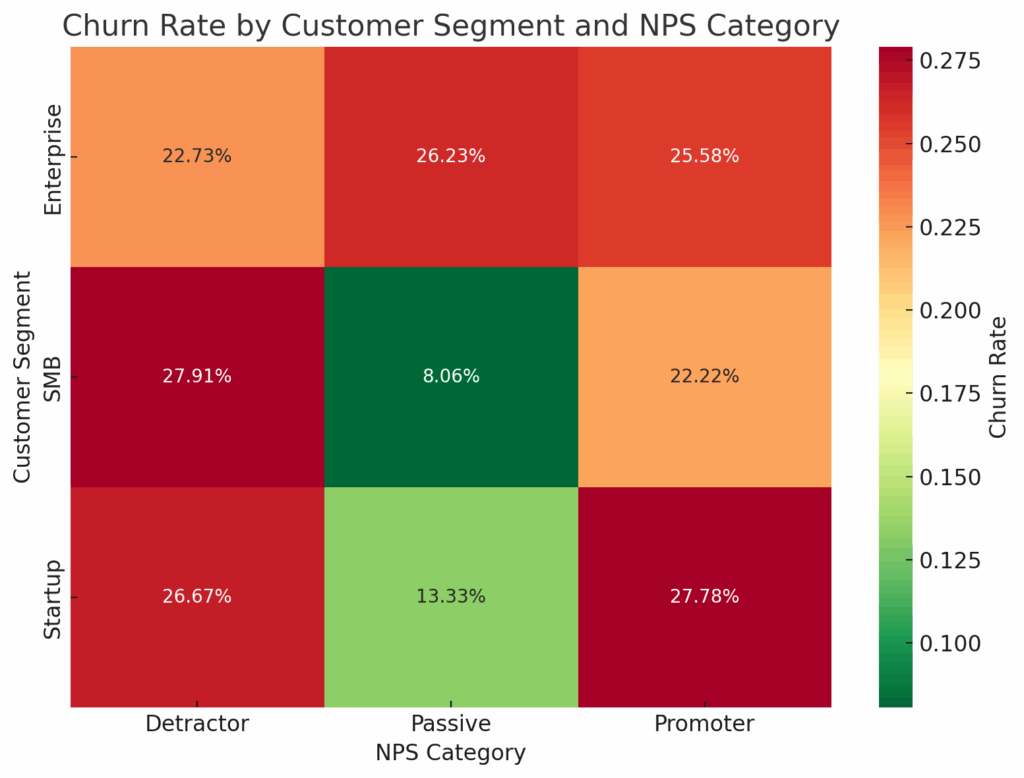
Here’s a heatmap illustrating the churn rate by customer segment and NPS category. As expected:
- Detractors show significantly higher churn rates across all segments.
- Promoters consistently exhibit the lowest churn, particularly within the Enterprise segment.
- Passives fall in between, but their churn rates vary more by segment, with Startups showing more volatility.
This view helps prioritize interventions: target Detractors in the SMB segment for retention, and reinforce loyalty programs among Promoters in high-value cohorts like Enterprise.
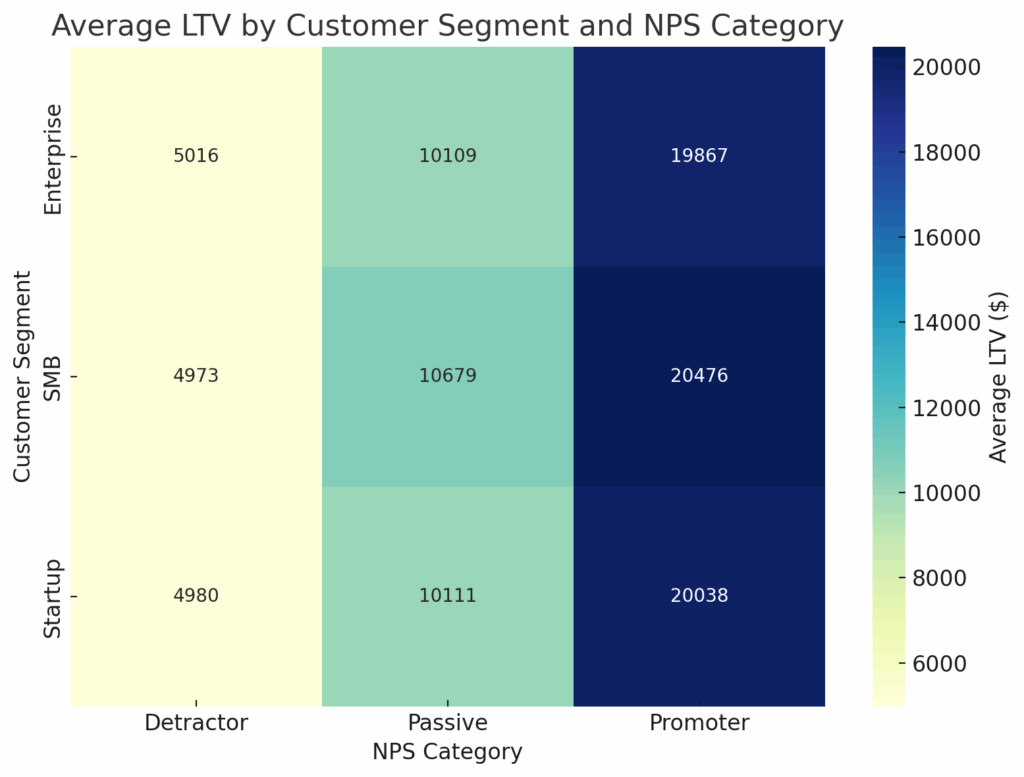
This heatmap visualizes average Lifetime Value (LTV) across customer segments and NPS categories. Key insights:
- Promoters consistently deliver the highest LTV across all segments—more than 4x that of Detractors in some cases.
- Enterprise Promoters are particularly valuable, suggesting strong retention and upsell potential.
- Detractors in SMB and Startup segments show both high churn and low LTV—highlighting urgent areas for service improvement or strategic reprioritization.
This layered view of NPS ? Churn ? LTV is foundational for revenue strategy.
Discover more from Jed Expert
Subscribe to get the latest posts sent to your email.